
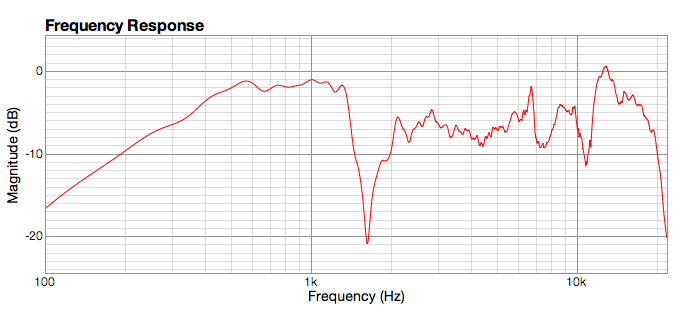
Earlier I wrote about a measurement anomaly in the initial measurements of the baffle. Here is the response of the mid again, at 1m:
Having just been trying to learn how to use the Edge simulator, I modeled an 80mm driver in a 300x900mm baffle, with the microphone at 1m distance. Look at this:
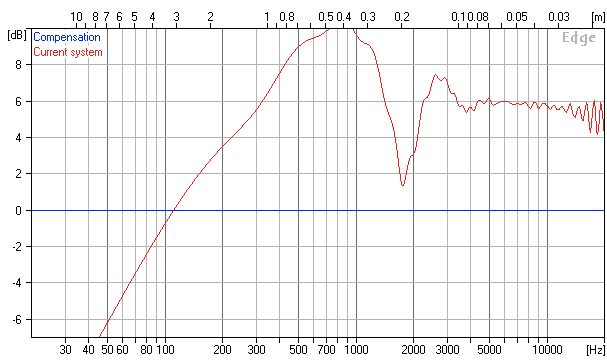
So there’s the notch at 1700 Hz (more or less), in the open baffle simulator. It’s good that there is at least some match between theory and the actual measurement, although I still don’t understand why the notch is where it is, as I thought it should have been at around 1150 Hz.
And there’s still that reduced output level above 2 kHz…… AHA! The light comes on. What I was seeing as a depressed output in the measurement from 2 kHz upwards is actually the normal output level of the driver (with some bumps and dips caused by dipole cancellation). The region between around 500 and 1300 Hz, which I thought was the normal level, is actually the dipole peak caused by constructive interference of the front and back waves. Although the measurement is flatter than the simulation (i.e. without the extra peak at 800 Hz), the edges are in the same place.
So the measurement matches up well with the simulation – it even shows a peak a little below 3 kHz, as in the simulation. And all that stuff above 6 kHz? – that’s just wild cone breakup in the “full-range” driver.
It’s forehead-slappin’ time!! I had the whole thing completely backwards. But seriously, this is great – a realisation about what is going on that will make it easier next time. That’s why Francesca is a learning tool.